At one point, people were calling 2015 the “best year for movies ever”. The current superhero craze was going to reach new heights with both Batman vs Superman and the sequel to the highest grossing film of all time not directed by James Cameron, Avengers 2; there was to be a follow-up to the first billion-dollar Bond; and there was the little matter of the return of Star Wars to boot. Of course, things didn’t pan out that way: Batman v Superman (not vs) got kicked to 2016; Avengers 2 disappointed quite a few people and didn’t set any box office records (which these days is essentially a failure, right?); but hey, at least Bond and Star Wars turned up… to a predictably mixed response.
Even if the wider world was mired in some form of disappointment or other, at least 2015 was the best year for movies ever for me. Regular readers will have already learnt about some of this year’s extraordinary numbers through my monthly progress reports, and there are even more to be found in the statistics section of this post — aka the best part of the entire year. And this year, there are more graphs than ever before!
So without further ado…
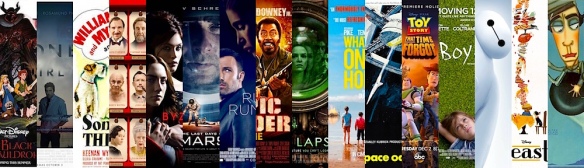
Here’s a graphical representation of my 2015 viewing, month by month. Handily, each of these images links to the relevant monthly update, where you’ll find the numbered list of everything I watched this year (amongst plentiful other jollities).
And now, in alphabetical order…


- 21 Jump Street (2012)
- About Time (2013)
- AfterDeath (2015)
- Aladdin and the King of Thieves (1996)
- Alan Partridge: Alpha Papa (2013)
- Alois Nebel (2011)
- American Sniper (2014)
 Ant-Man (2015)
- Argo (Extended Cut) (2012/2013)
- L’Atalante (1934)
- Avengers: Age of Ultron (2015)
- Avengers Confidential: Black Widow & Punisher (2014)
- The Babadook (2014)
- Back in Time (2015)
 Before Dawn (2012)
- Begin Again (2013)
- Behind the Candelabra (2013)
- Bernie (2011)
- Beverly Hills Cop (1984)
- Big Hero 6 (2014)
- The Big Knife (1955)
 Birdman: or (The Unexpected Virtue of Ignorance) (2014)
- The Black Cauldron (1985)
- Blitz (2011)
- Blue Ruin (2013)
- Boyhood (2014)
- Boyz n the Hood (1991)
- Brazil (1985)
 Building Empire (2006)
- Bullet to the Head (2012)
- Byzantium (2012)
- Changing Lanes (2002)
- Circle (2015)
- A Clockwork Orange (1971)
- Coherence (2013)
 Come Drink with Me (1966), aka Dà Zuì Xiá
- Contagion (2011)
- The Crab with the Golden Claws (1947), aka Le Crabe aux Pinces d’Or
- The Dark Crystal (1982)
- The Death of “Superman Lives”: What Happened? (2015)
- The Decoy Bride (2011)
 Dreamgirls (2006)
- Dreams of a Life (2011)
- Dressed to Kill (1946)
- The Eagle (2011)
- Ed Wood (1994)
- Empire of the Sun (1987)
- End of Watch (2012)
 Ender’s Game (2013)
- Escape from Tomorrow (2013)
- Europa Report (2013)
- The Expendables 3 (Extended Version) (2014)
- The Falling (2014)
- The Fifth Estate (2013)
- Filmed in Supermarionation (2014)
 Force Majeure (2014), aka Turist
- Forty Guns (1957)
- Foxcatcher (2014)
- Fury (2014)
- The General (1926)
- Ghost Dog: The Way of the Samurai (1999)
- The Girl with the Dragon Tattoo (2011)
 Go (1999)
- God Bless America (2011)
- Godzilla (2014)
- The Golem: How He Came into the World (1920), aka Der Golem, wie er in die Welt kam
- Gone Girl (2014)
- The Grand Budapest Hotel (2014)
 The Grandmaster (2013), aka Yi dai zong shi
- Grosse Pointe Blank (1997)
- The Guest (2014)
- Hancock (Extended Version) (2008)
- Happy Feet Two (2011)
- Heaven Can Wait (1943)
- High Noon (1952)
 The Hobbit: The Battle of the Five Armies (2014)
- Horns (2013)
- The Hound of the Baskervilles (1981), aka Priklyucheniya Sherloka Kholmsa i doktora Vatsona: Sobaka Baskerviley
- How to Train Your Dragon 2 (2014)
- Hummingbird (2013), aka Redemption
- The Hunger Games: Mockingjay – Part 1 (2014)
 Hyde Park on Hudson (2012)
- The Informant! (2009)
- Inherent Vice (2014)
- Inside Out (2015)
- Interstellar (2014)
- The Interview (2014)
- Jack the Giant Slayer (2013)
 John Wick (2014)
- Jupiter Ascending (2015)
- Jurassic World (2015)
- Justice League: The New Frontier (2008)
- Killing Them Softly (2012)
- Kingdom of Heaven: Director’s Cut (2005)
- Kingsman: The Secret Service (2015)
 Ladyhawke (1985)
- The Last Days on Mars (2013)
- Last Passenger (2013)
- Life Itself (2014)
- Life of Pi (2012)
- Lilo & Stitch (2002)
- The Lone Ranger (2013)
 Looper (2012)
- The Machine (2013)
- Machine Gun Preacher (2011)
- Mad Max 2 (1981), aka The Road Warrior
- Mad Max Beyond Thunderdome (1985)
- Mad Max: Fury Road (2015)
- Man of Tai Chi (2013)
 Meet the Robinsons (2007)
- Le Mépris (1963), aka Contempt
- Midnight in the Garden of Good and Evil (1997)
- A Million Ways to Die in the West (2014)
- Mission: Impossible – Ghost Protocol (2011)
- Mission: Impossible – Rogue Nation (2015)
- Monsters: Dark Continent (2014)
 Monsters University (2013)
- Morning Glory (2010)
- A Most Wanted Man (2014)
- Mr. Holmes (2015)
- Murder by Death (1976)
- Necessary Evil: Super-Villains of DC Comics (2013)
- North West Frontier (1959), aka Flame Over India
 Now You See Me (2013)
- Olympus Has Fallen (2013)
- One-Eyed Monster (2008)
- Paddington (2014)
- Pain & Gain (2013)
- Parabellum (2015)
- Parker (2013)
 The Passion of Joan of Arc (1928), aka La Passion de Jeanne d’Arc
- Persona (1966)
- The Philadelphia Story (1940)
- Pursuit to Algiers (1945)
- Raging Bull (1980)
- RED 2 (2013)
- Red Sonja (1985)
 Returning to Jedi (2007)
- Robot & Frank (2012)
- The Rocketeer (1991)
- Room 237 (2012)
- Runner Runner (2013)
- Rush (2013)
- Safety Not Guaranteed (2012)
 Salvation Boulevard (2011)
- Scanners (1981)
- Seeking a Friend for the End of the World (2012)
- Seven Psychopaths (2012)
- sex, lies, and videotape (1989)
- Shadow of the Thin Man (1941)
- Shallow Grave (1994)
 Shaun the Sheep Movie (2015)
- Sherlock Holmes (1922), aka Moriarty
- Shivers (1975)
- Shutter Island (2010)
- Slow West (2015)
- Song of the Sea (2014)
- Song of the Thin Man (1947)
 Space Station 76 (2014)
- Spectre (2015)
- Spooks: The Greater Good (2015)
- Star Wars Begins (2011)
- Star Wars: The Force Awakens (2015)
- Stoker (2013)
- The Story of Film: An Odyssey (2011)
 Stranger by the Lake (2013), aka L’inconnu du lac
- The Sugarland Express (1974)
- Superbad (2007)
- Superman vs. The Elite (2012)
- Supermen of Malegaon (2008)
- The Swimmer (1968)
- Tank Girl (1995)
 Tarzan (1999)
- Terminator Genisys (2015)
- Terror by Night (1946)
- The Theory of Everything (2014)
- They Live (1988)
- The Thief of Bagdad (1924)
- The Thin Man Goes Home (1945)
 The Thing (1982)
- The Thing (2011)
- Time Lapse (2014)
- TMNT (2007)
- Tomorrowland: A World Beyond (2015)
- Transcendence (2014)
- Tropic Thunder: Director’s Cut (2008)
 Turtle Power: The Definitive History of the Teenage Mutant Ninja Turtles (2014)
- Twilight (2008)
- Valkyrie (2008)
- Videodrome (1983)
- Violet & Daisy (2011)
- The Voices (2014)
 What Dreams May Come (1998)
- What We Did on Our Holiday (2014)
- Whiplash (2014)
- White House Down (2013)
- Willow (1988)
- Wings (1927)
- The Wrestler (2008)
 You’re Next (2011)
Other Reviews
I watched a record-obliterating 200 new feature films in 2015. (All are included in the stats that follow, even if there’s no review yet.) That’s far and away my highest tally ever, beating last year’s previous best, 136, by 47%.
I also watched three features I’d seen before that were extended or altered in some way, and chose to review two others for the fun of it. Four of those films are included in the statistics that follow, the exception being Transformers: Age of Extinction, which I ‘reviewed’ without actually watching.
I also watched five short films, which is within my usual range. Also as usual, none of them are counted in the following statistics (apart from the one that mentions it includes them).
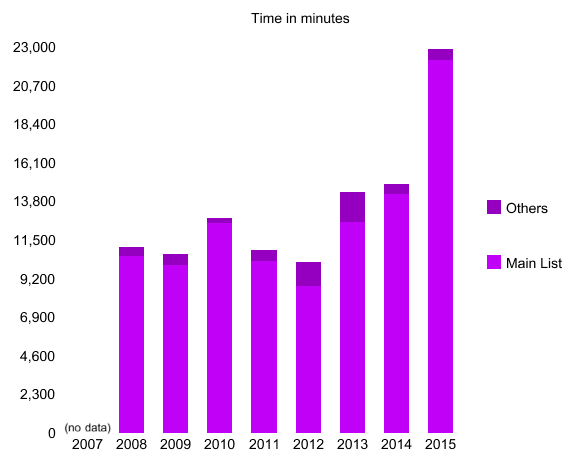
The total running time of new features this year was a mind-bending 369 hours and 56 minutes. Put another way, that’s just shy of 15½ days. Unsurprisingly, it’s a new record. How much so? Well, for perspective, 2013’s running time was also a record-setter, exceeding the previous best by 58 minutes. Then 2014 broke that record by a massive 28 hours. Now 2015’s done it by almost 133 hours. That increase alone is equivalent to 5½ days of solid viewing. To round that out, the total running time of all films (including shorts) was 381 hours and 31 minutes. Here’s all that as a graph:
Now: the who, what, where, when, and how of that viewing. (This is a theme that will become apparent as we go, I promise.)
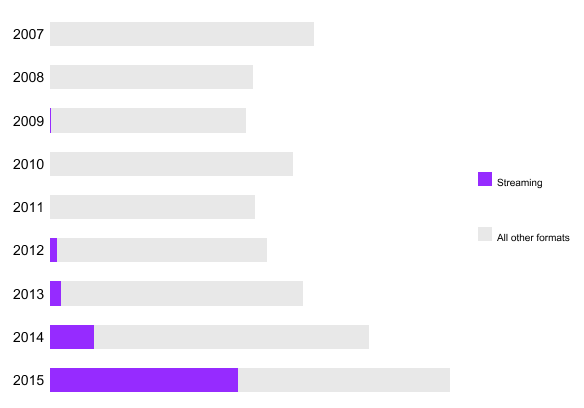
In a massive upset to the status quo, this year’s most prolific format was streaming — and not just by a little: it accounted for 96 films, a massive 47% of my total. Who’d’ve thunk that a few years ago?! It was ‘big news’ last year when it was in third place with 23, but this year more than quadruples that. Partly that’s because this year I’ve finally used some free trials: at one time or another in the past 12 months I’ve had Now TV (i.e. Sky Movies), Amazon Prime Instant Video, MUBI, and Netflix, not to mention taking advantage of those digital discounts Amazon sometimes give to rent newer movies.
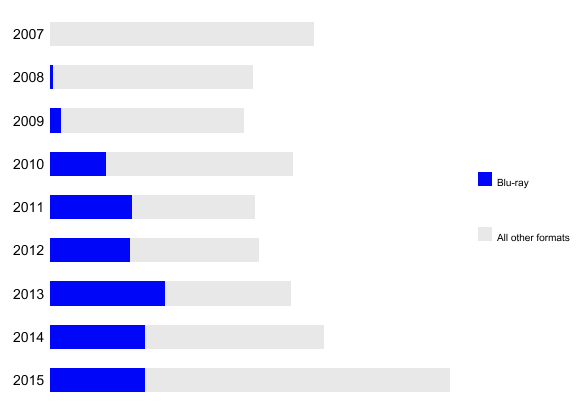
That means the previous two years’ victor, Blu-ray, comes second. I watched 49 films on that format, the exact same number as last year… which of course means it’s lower in percentage terms, at 24% vs. last year’s 35%. I really ought to shift my viewing habits away from streaming and in favour of Blu-ray, because I have tonnes of the things stacked up.
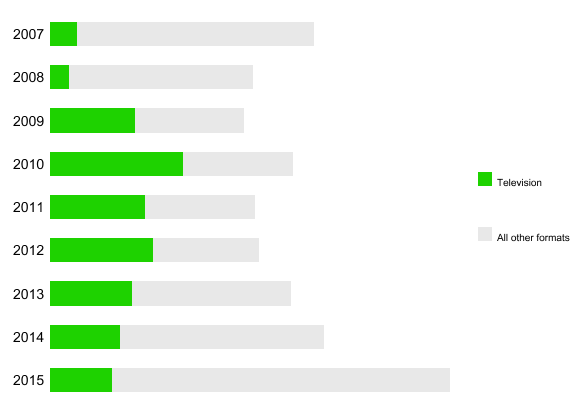
Third place belongs to television, with 32. A slight decrease from last year (and even more so in percentage terms, obviously). Why? Who knows. Partly, I expect, because a lot of channels seem to show the same films on loop. I’m also not very good at being beholden to TV schedules (I barely watch any TV ‘live’ either) and my V+ box is permanently almost-full with stuff I’ve already recorded and not got round to.
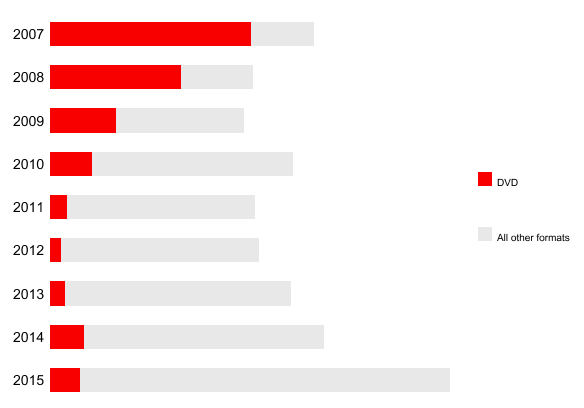
In fourth we have the once-mighty DVD, with just 16 (7.8%). That’s better than 2010 to 2012, but a bit down on last year. I have even more of these unwatched than I do Blu-rays, so I ought to get stuck into them more. I say that every year, though.
Penultimately, downloads accounted for nine films this year. Bigger news, though, is last place: this year, I actually bothered to go to the cinema for the first time since 2012 — twice. Such is the lure of new Bond and new Star Wars. And y’know, it reminded me that sometimes it’s worth the extra effort and expense. With some big spectacle-y movies coming up this year, maybe I’ll make the effort more often.
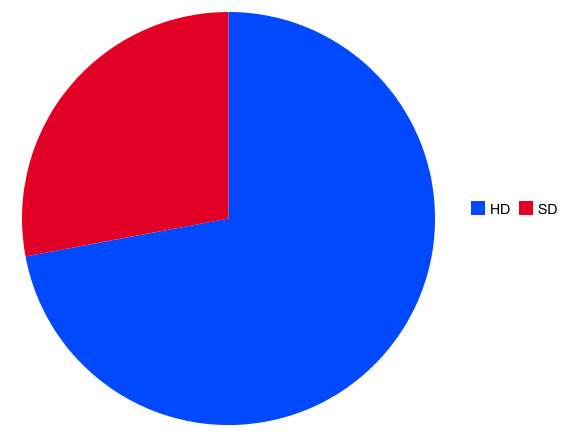
Finally for formats, I thought I’d tally up how many films I watched in HD vs. SD. In the superior quality camp, you’ve got all the Blu-rays and my pair of theatrical viewings, plus 86 on streaming, seven on download, and three on TV. For SD, that just leaves the remaining 29 TV viewings, 16 DVDs, 10 streamed films, and two downloads. To summarise, 72.1% of my viewing was in glorious high definition.
That’s the ‘how’ I watched my films, but what about the ‘when’: how old were the films I watched in 2015? Well, last year the most popular decade was our current one, contributing a “whopping” (to quote year-ago me) 50.7% of my viewing. That was the first time a single decade had accounted for over half my viewing since 2009. This year, the 2010s are top again, with 128 films — which is 62.75%! I’m always trying to catch up on recent films, and I guess the deeper we get into the decade, the more “recent films” are from it.
In second place, unsurprisingly, was the next-most-recent decade, the ’00s. With 18 films, aka 8.8%, it wasn’t even close. What it was close to was third, which is a surprise-high finish for the ’80s, on 17 (8.3%). I must say, it definitely felt like I watched a lot of ’80s movies this year, exacerbated by their mini stylistic revival in films like The Guest. In fourth place is the only other decade to make double figures, the ’90s, with 12 (5.9%).
Moving further back in time, every decade since the ’20s was represented. Last year I managed to stretch back to the 1910s, but I skipped the ’20s, so it’s all equal. In fact, the last time I watched a film from the ’20s was 2010. They fared considerably better this year, reaching six (2.9%). Just ahead of them were the ’40s with nine (4.4%), and just behind were the ’60s with five (2.5%). Rounding out the field, the ’50s and the ’70s tied on four (2%), and the ’30s brought up the rear with one (0.5%).

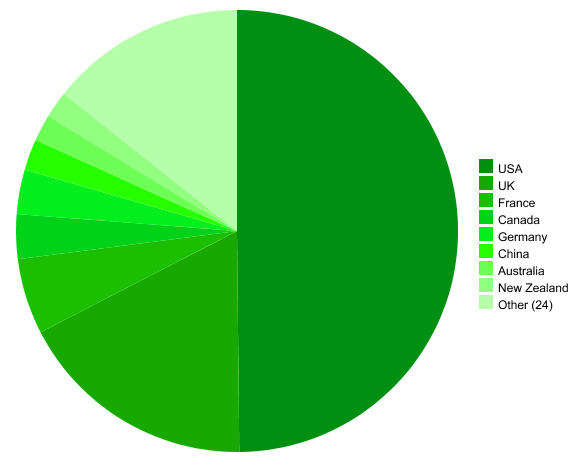
Next up: ‘where’ — as in, where were the films from? We’ll begin with the better indicator: language (because, as we’ll see, “country” gets all mixed up with co-productions). As ever, English was massively dominant, featuring wholly or in part in 187 of the 204 films. That’s 91.67%, a minor increase on last year’s 91.3%, but hardly a meaningful one. For one thing, several films you would certainly label as “foreign language”, like Force Majeuere and Le Mépris, feature enough English to have it as a listed language and therefore contribute to this total. Despite the possibility of such shared languages, nothing else comes close: French is second with eight (3.9%), closely followed by silent films with seven (3.4%). Better were the number of different languages heard: last year reached a high of 15, which 2015 exceeds with 24 (plus one for “silent”, in each case). More uncommon ones include Acholi, Hawaiian, and Scottish Gaelic.
There’s a similar increase in countries of production: last year there were 27, this year it’s 32. It’ll come as no surprise that the USA once again dominated, with 153 films. As ever, thanks to co-productions these aren’t all films you’d identify as “American”, but I guess that’s balanced out in the final tally by all the international co-productions that you wouldn’t consider to hail from those countries either. Nonetheless, 153 is exactly 75% of this year’s films, which is slightly down on the 80.4% the US represented last year.
In second place, an equally-unsurprising showing for my home team, i.e. the UK. Producing or contributing to 54 films gives it 26.5%, a nice increase on last year’s 18.1%. Last year there were only five other countries that could claim a part in three or more films, but this year there are 11. Heading up the board is France with 17; joint fourth are Germany and Canada with 10 apiece; China had a hand in seven; and Antipodean cousins Australia and New Zealand both tallied six (with significant help from George Miller to the former and Peter Jackson to the latter). Also with 3+ were: Hong Kong (five), Japan and Ireland (four each), and Belgium and Sweden (three each). That leaves six countries with two, and thirteen with one. Those with a definite claim to “country of origin” include Argentina, India, and the Soviet Union.
In terms of ‘what’ I watched, there are a few different observations. First up: how the BBFC and MPAA classified them. Showing the parity everyone always perceives, both the BBFC’s 12 and MPAA’s PG-13 totalled 41 films this year. That’s about the same number as last year, meaning the 20.1% it represents is down. The most prolific certificates this year are, respectively, the 15 (83 films, 40.7%) and R (86, 42.2%), because I’m a growned-up, innit. You can never discount the MPAA’s unrated category, which bests even the PG-13 with 50 titles (24.5%). Rounding out the field, the BBFC seem more prepared to go for their child-friendly U (20, 9.8%) than the MPAA do their G (four, 2%), while the figures for PG are about equal, with the BBFC on 26 (12.7%) and the MPAA on 23 (11.3%). In fact, in both instances the increase is likely thanks to older films, which tend to sit at the U/PG level, and the BBFC still have to classify but the MPAA don’t (so they go into unrated). Oh, and the BBFC’s 18 equalled the U with 20 (9.8%), while somehow 14 films (6.9%) managed to go BBFC-free.
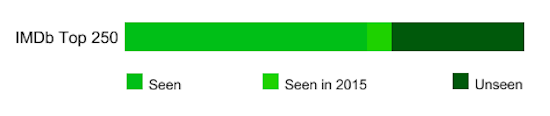
15 films from the main list appear on the IMDb Top 250 at the end of 2015 — the exact same number I achieved last year. It would’ve been slightly more if I’d finished What Do You Mean You Haven’t Seen, as the three of those I missed are also on there. The positions of the ones I did see range from 29th (Interstellar) to 231st (High Noon). I currently have 83 of the Top 250 left to see — the first time I’ve got that number below 100. Lovely.
Now, a new addition to the stats: as I’ve started including a “most read new post” part in my monthly progress reports, I thought I’d do so here too. As if to prove the endurance of having a review archive, this year’s most read (or, at least, most visited) new post was only the 12th most-read post of the year. It slips in behind not only three Harry Potters but a few (well, eight, obviously) other randomers (2 Fast 2 Furious is third — why?!) And that victor is… a little surprising, because I have no idea why it’s been so well-read — it wasn’t posted for a blogathon; it didn’t get retweeted by a fan group, member of the production team, or Film4 (all of which have happened to other of my reviews this year). It is a damn fine film, though: it’s Requiem for a Dream.
Speaking of additions, every year I feel I’d like to include stats on which genres I most watched, or which actors were regularly represented. This year, for instance, it felt like I watched a lot of Channing Tatum films (there were five), and Rachel McAdams kept cropping up towards the end (three times in December) — but is that so unusual? I mean, for starters, there were three supporting-lead roles for Harrison Ford in my viewing this year, but they were less noticeable because they were more spread out. I never add these things because, due to the way I compile my stats (I shan’t bore you with the details), it would be very hard/impossible. Hey, maybe next year.
One thing I did do this year, however, was inspired by my comment that I seem to have watched a lot of documentaries. Consequently, I tallied how many of the films I watched were documentaries, how many were animated, and dumped the rest into “live-action fiction”. Not quite a genre stat, more a form one. And the results were: 13 documentaries (6.4%), 18 animated movies (8.8%), and 173 live-action fiction movies (84.8%). Obviously the last category dominates, but I don’t think that’s by any means a bad showing for the first two. (For what it’s worth, I counted The Dark Crystal as live-action, because it’s puppets filmed in real-time rather than, say, stop-motion animation.)

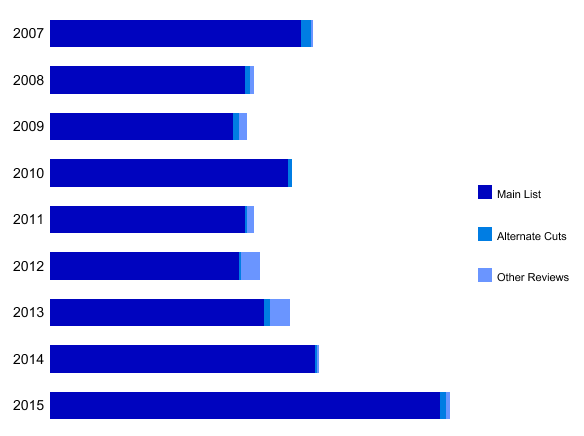
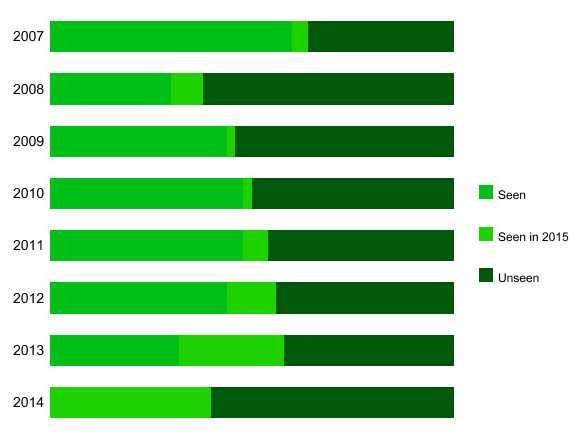
At the end of every previous year-end summary I’ve included a list of 50 notable films I’d missed from that year’s releases, and have since tracked my progress at watching those ‘misses’. In 2015, I’ve seen more movies from every year’s list. To rattle through them, with the overall total I’ve now seen in brackets, this year I watched: two from 2007 (32); four from 2008 (19); one each from 2009 (23) and 2010 (25); three from 2011 (27); six from 2012 (28); and 13 from 2013 (29). That’s a moderately consistent number watched from each year, with the exception of 2008’s lowly tally. I don’t know what I did wrong with that year’s 50, but it’s become a real black sheep.
Finally, in the first year of 2014’s 50, I watched 20 of them. That’s the best ‘first year’ ever (besting the 17 from 2007 I watched in 2008), and is more in one year than I’ve managed in the seven since 2008. Seriously, what was wrong with that list?!
The graph shows my progress year by year (obviously), but I can tell you I’ve seen 203 out of 400 ‘missed’ movies, which is 50.75% — a tidy improvement on last year’s 43.7%. Of course, I own or have access to over 100 of the remaining 197, so I could do even better.
After ‘what’, ‘where’, ‘when’, and ‘how’, all that remains is ‘who’ — who made these 204 feature films? A total of 155 solo directors and 17 directing partnerships appear on 2015’s main list. Obviously that’s the most ever — considering this year is up 47% on even the next-best year, which was itself a significant record-breaker, then of course the director total is up a lot too. It’s not up 47% though, but 33.3%.
That’s because a massive 23 of those directors have multiple films on the list (for perspective, last year it was just 10). Most prolific is Steven Soderbergh, with four. Next, George Miller has three to his own name, plus he was part of a partnership. There are three each from Jamie Benning, Bill Condon, David Cronenberg, Roger Michell, and Roy William Neill, while Bryan Singer has two main list films and an extended cut, and Peter Jackson has one main list film but two extended cuts. With two main list films each we find David Ayer, Brad Bird, John Carpenter, Clint Eastwood, David Fincher, Ron Howard, Richard Linklater, Carol Morley, Martin Scorsese, Steven Spielberg, Colin Trevorrow, and Adam Wingard, while Stanley Kubrick has one main list film and one other review. Finally, Dean DeBlois has a solo credit and another as part of a partnership.
At a time when their prevalence (or lack thereof) is a point of discussion, I can say that eight of those directors were female, as was half of one directing partnership. I’m sure that’s better than it has been in the past, but, as you can see from this graph, it’s not actually very many…
And so we come to the climax of the statistics: how I rated 2015’s viewing.
I’ll start by saying that almost all of these are their highest-ever total — no surprise considering how many more films than normal I watched this year. The only exception, happily, is one-star films, of which there were two. Appropriately, that rating usually only totals ‘one’, so for it to come to double that in the year I watched exactly double my target… well, that’s just synergistic.
At the other extreme, this year there were 40 five-star films. That’s 11 more than the next best year, which will surely make compiling my top ten fun, but it’s still just 19.6% of 2015’s viewing. For perspective, my all-time percentage of five-star films is around 17.2%, so it is marginally above average. In terms of all previous years’ percentages, it ranks third.
The most prolific ranking, for the eighth year (of nine), is four-stars, of which there were 92 in 2015. At 45.1% that’s almost bang-on average (44.8%), and ranks fourth all-time. Second most prolific, for the seventh year, is three-stars, with 51 films, or exactly 25%. That’s also darn close to the all-time average (26.2%) but ranks joint third, just behind the anomalously high percentages of 2012 (38%) and 2013 (35.8%). Have I got more lenient since then? If anything, I think I’ve started marking a little tougher… I just endeavour to watch fewer weak/middling films. Finally, there were 19 two-star films, which at 9.3% is — as you’ve likely guessed — broadly in line with the previous average (10.3%).
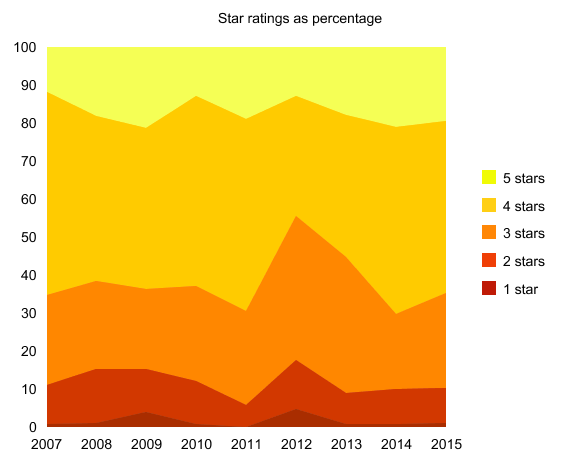
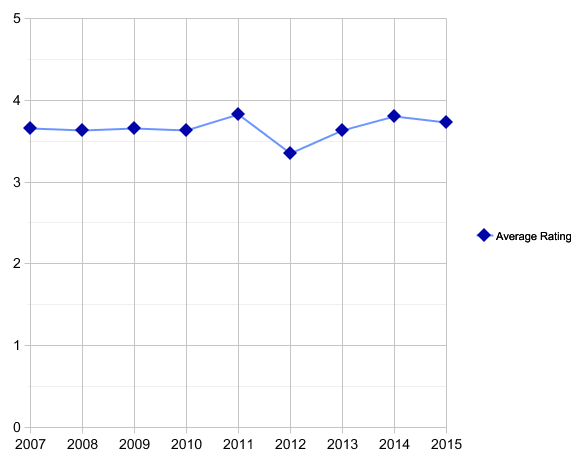
Finally, the all-important average score — the marker of the overall quality of my viewing this past year. Officially, it comes out as 3.7, the same as 2007 and 2009, but I can tell you that it’s actually the third best year ever, with the more precise figure being 3.730. If I scored in percentages, that would be 74.6%, slipping in behind 2011’s 76.6% and 2014’s 76.1%, and ahead of 2009’s 73.1%.
And that’s it for another year, ladies and gents.
Next time: the best and worst films I saw for the first time in 2015.


