
Here we go, people! It’s happening! Iiiiiiit’s… the statistics! (People cheer, fireworks explode, dogs and cats live together, etc, etc.)
But… before the onslaught of numbers and graphs begin, a reminder that these stats cover my first-time feature film watches from 2025, as listed here. Shorts and rewatches are only factored in when expressly mentioned. Also, as a Letterboxd Patron member, I get a yearly stats page there too. The numbers will look different because I also log (some) TV, and it factors in shorts and rewatches more thoroughly — but that’s all part of what makes it worthwhile as an addition to this post. Plus, it includes some interesting things that I don’t, like my most-watched and highest-rated stars and directors. More stats are always good, right?
Speaking of which, for the first time since 2018, this post includes a new graph. Oooh! What could it be?! Well, it’s a special and unusual one — not necessarily one I’ll include every year going forward (though, hey, never say never), but something that speaks to this year in particular. It’s coming up relatively early on, so you won’t have to endure my crypticness for too long.
But I know you’re really champing at the bit to get started after that revelation, so let’s crack on…
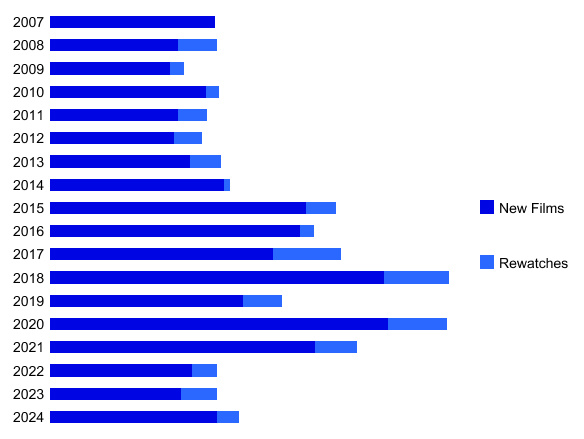
I watched 116 feature films for the first time in 2025. That’s down on 131 from last year, but up on every other year since my relaunch in 2022 (and it’s massively down on the years before that, hence treating the relaunch as some kind of cutoff). Overall, for size it ranks 12th out of all 19 years.
Of those 116, 88 counted towards my 100 Films in a Year Challenge. I did complete my Challenge this year (check out the Final Standing post and December review for more on that), with the remainder being 12 rewatches. That was all of my rewatches this year though, my lowest total in a decade — no wonder it was after that year (2016) that I started to make a conscious effort to rewatch stuff. Do I need to make even more of an effort, or is the 12 required by the Challenge an adequate amount? Something I’ll think on.
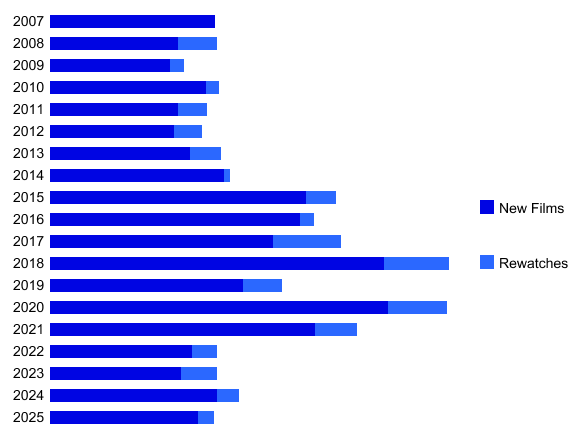
NB: I have no rewatch data for 2007 and incomplete numbers for 2008.
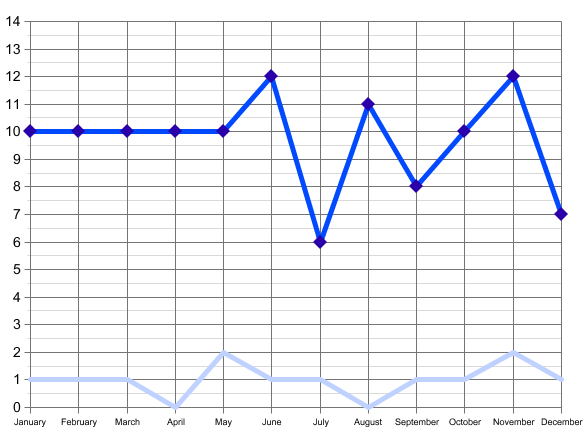
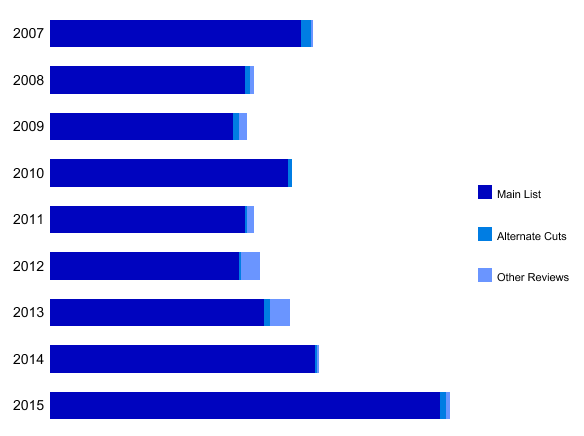
Here’s how that viewing played out across the year, month by month. The dark blue line is my first-time watches and the pale blue is rewatches. As you can see, things started out nice and flat, hitting my ten-films-per-month minimum goal consistently, but then it goes kinda crazy. I’m not sure there was a specific reason why. It would be nice to see no months dropping below that ten line, though, and more spiking above it wouldn’t hurt.
I also watched six short films. That’s thoroughly unexceptional: not my worst year; far from my best; down quite a lot (relatively) on the last two years. Of course, I don’t make a specific effort to watch shorts — if I did, I’m sure they’d be higher. Maybe I should? Maybe it’s not worth it?
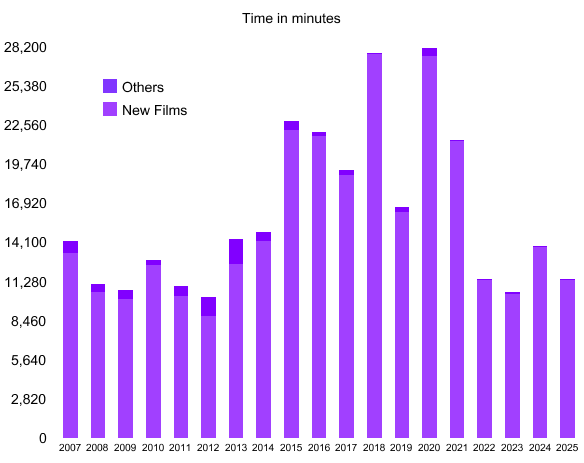
The total running time of my first-watch features was 189 hours and 35 minutes. That places the year 13th overall. It’s unusual for the running time position to not match the film total position, which suggests I overall watched shorter films this year. Thinking back over the kind of films I chose to watch and how I made decisions (a lot of “what can I squeeze in?”), that doesn’t really surprise me. If anything, it surprises me that it doesn’t happen more often… although, if I do that every year, it wouldn’t change anything in comparison, so maybe it’s not surprising. Add in the shorts and that rises by just under an hour-and-a-half, to 191 hours and 3 minutes. (The additional bit is labelled as “other” on the graph because it used to include alternate cuts of features that I watched for the first time but didn’t count towards the main tally. It’s been many years now since there were any, but I’d have to go back and recalculate most a dozen or more recorded years to make this shorts-only.)
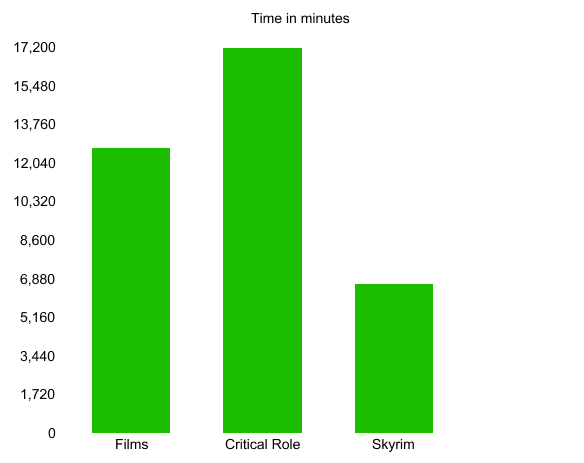
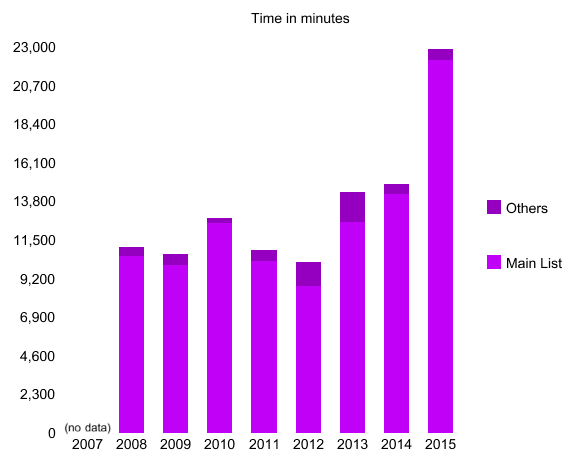
One thing I’ve noted in a couple of monthly reviews throughout 2025 is how much time I’ve spent on specific non-film things — primarily, watching Critical Role (although that began, and was even more prevalent, in 2024) and playing Skyrim. So, I thought it would be fun to throw in a new graph for comparison purposes: how much time I spent watching films (for this graph I’ve also added in the 12 rewatches), how much time I spent watching Critical Role content (main campaign episodes, miniseries, one-shots, and chat shows like Talks Machina and Cooldown), and how much time I spent playing Skyrim (which, importantly, is just for two months, because I only started it in early November).
But what if those two months of Skyrim had been the same for the whole year? Well…
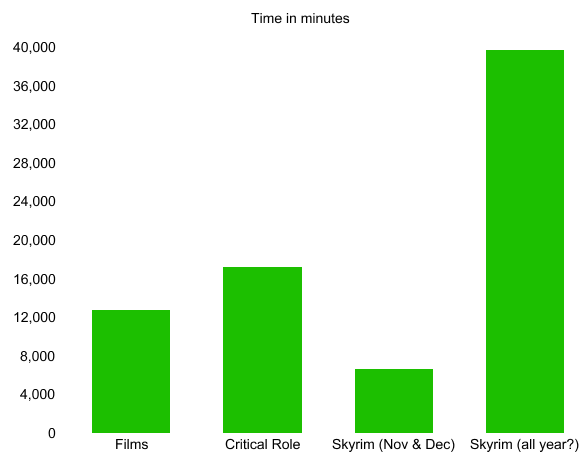
Well, crikey. Is that what 2026 will look like? Will I really play another 660+ hours of Skyrim? I doubt it… but you never know: there are reported playtimes that surpass 725 hours, and that’s just people who’ve bothered to log it on HowLongToBeat. And even if it’s not Skyrim, I feel like I’ve caught the bug of playing big open-world RPGs, of which I already own several more. It might seem silly to call a games console “life changing” but, well, getting a Steam Deck has certainly changed what I spend large chunks of my life doing.
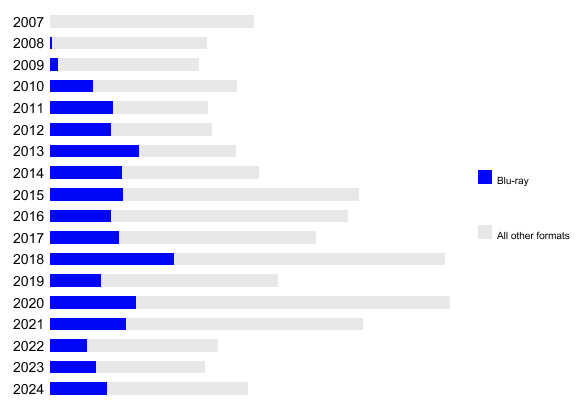
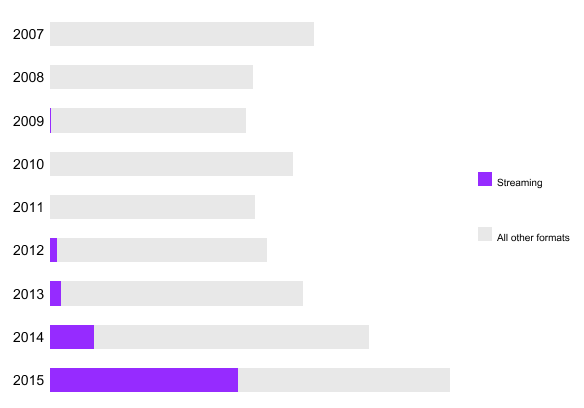
Alright, let’s shift the focus back to films, but sticking with technology: the ways in which I watched those films. For one brief, glorious moment I thought Blu-ray was finally the victor in this category (it last topped it in 2014)… then I counted streaming properly and it just had the edge. And then I remembered that nowadays I combine streams and downloads into digital, which wins easily with 60 films. I realise this is the end result of my own viewing choices, not some external fact I can’t control, but I watch what I want to watch where I can currently get it, and the convenience of streaming clearly wins out too often (not to mention streaming exclusives. I mean, if I waited for disc to watch Wake Up Dead Man, there’s a high chance I’d never ever see it). Anyway, digital sits at its lowest percentage (51.7%) since 2019, which was the last time it was below 50%, so maybe next year.
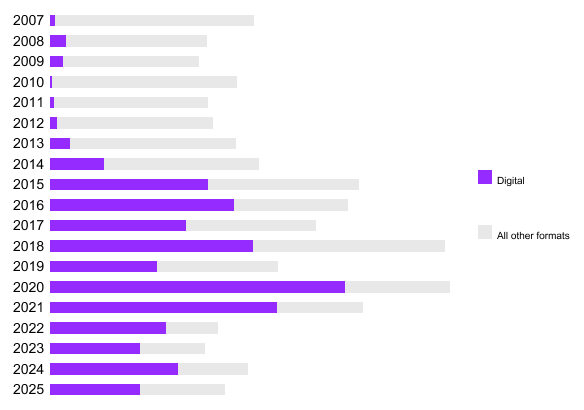
As noted, “digital” encompasses multiple different platforms and methods. The top one this year was Amazon Prime Video with 15 films (25% of digital), knocking downloads into a close second with 14 films (23.3%). That means the otherwise-ubiquitous Netflix charts third with 11 films (18.3% — or just 9.5% of all first-time watches), with NOW next on seven films (11.67%), and the numbers rounding out with Disney+ on four (6.67%), iPlayer and Tubi on 3 apiece (5%), YouTube on two (3.3%), and one from MUBI (1.67%).
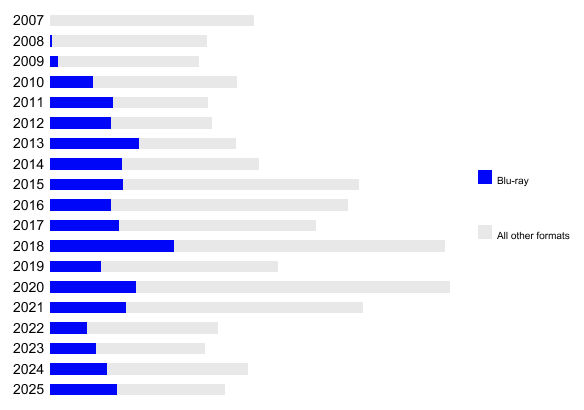
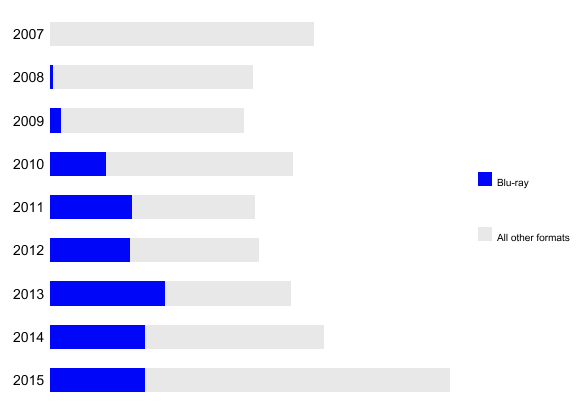
In overall second place was Blu-ray, with its 45 films (38.8%) representing the format’s highest number since 2021 and best percentage share since 2013. I’d say that’s something to build on, but I know from experience that what happens one year rarely has any bearing on the next.
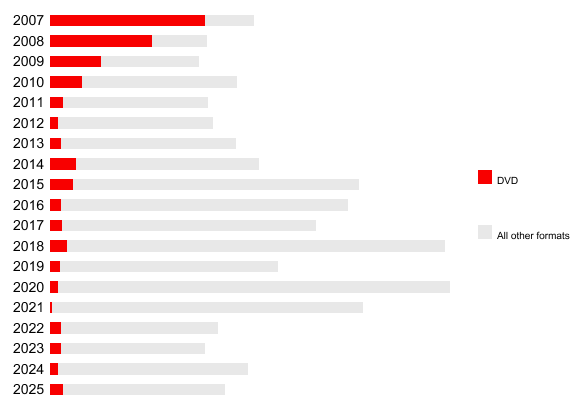
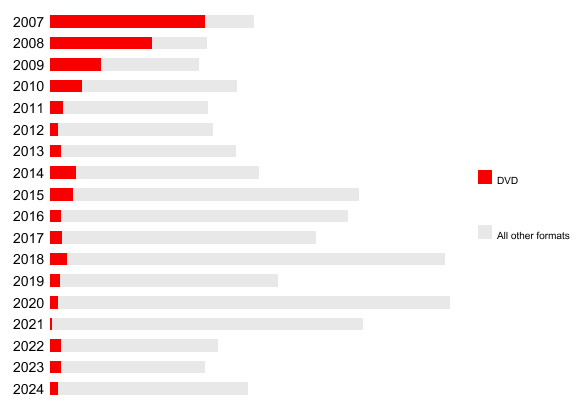
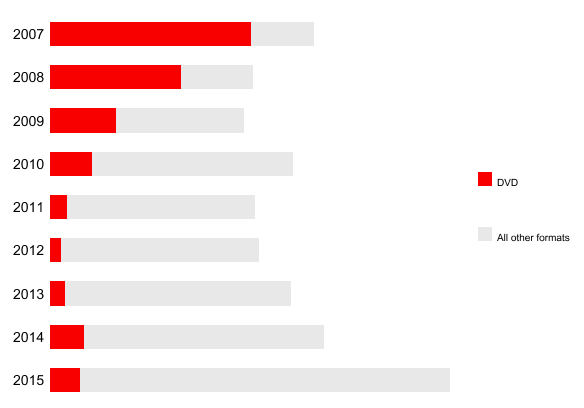
DVD saw a slight uptick this year, totalling nine films (7.8%), which is close to the figure from 2022 and 2023. It hasn’t been in double figures since 2018, and hasn’t been above 10% of my viewing since 2014, so the less I think about how many hundreds of them I have unwatched, the better.
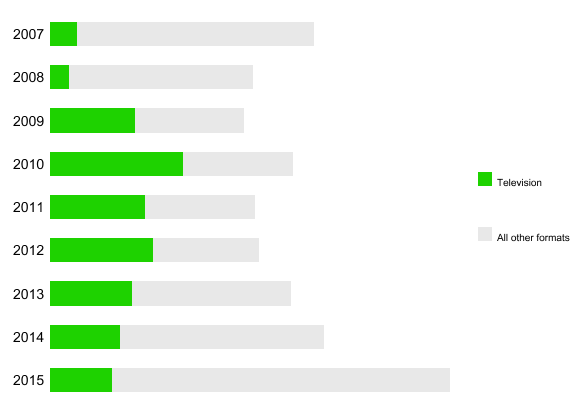
After popping back into contention with one film last year, TV’s disappeared again. I hardly watch anything on live TV fullstop nowadays — even when something’s on the BBC, I’m more likely to catch up with it on my own schedule via iPlayer — so no surprise I don’t watch any films that way anymore. If you’d still like to see a graph, there’s one in last year’s stats.
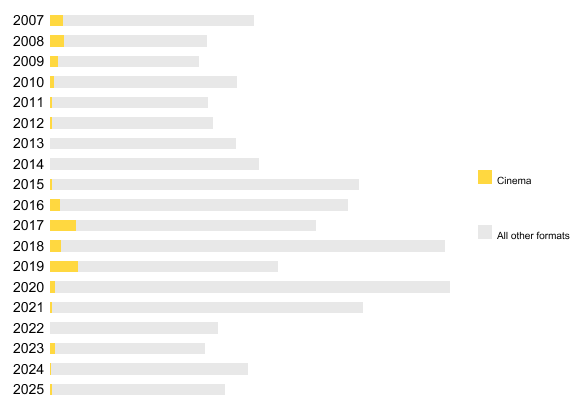
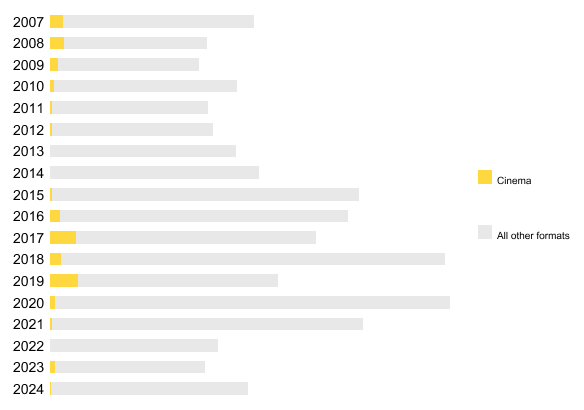
Instead, let’s move on to the final format left with something to actually record: cinema. I doubled my cinema trips this year… to two. Those would be a theatrical-only release of the filmed version of the stage production of Macbeth starring David Tennant, and the final Mission: Impossible movie. And, to be honest, very little else even tempted me to consider heading out to the cinema. Am I a bad film fan? Was everything this year that uninspiring? I’m not sure. Either way, I’m certainly not going to attempt any kind of commitment to improve that going forward.
Sticking with formats for a minute, first the disappointing news that I only watched 2 films in 3D. We can debate the death and decline of the format all you want (no one’s trying to claim it’s not well past its zeitgeist, but a lot of big movies still seem to get 3D versions theatrically), but I have plenty of discs unwatched, so I ought to make an effort to pump those numbers up.
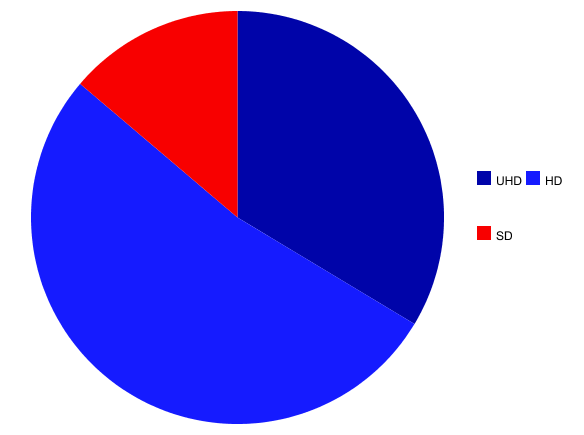
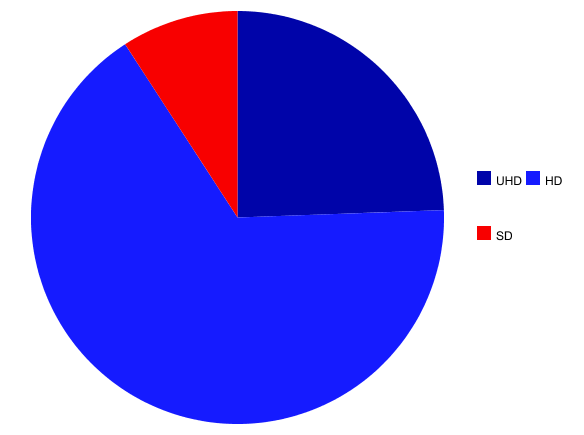
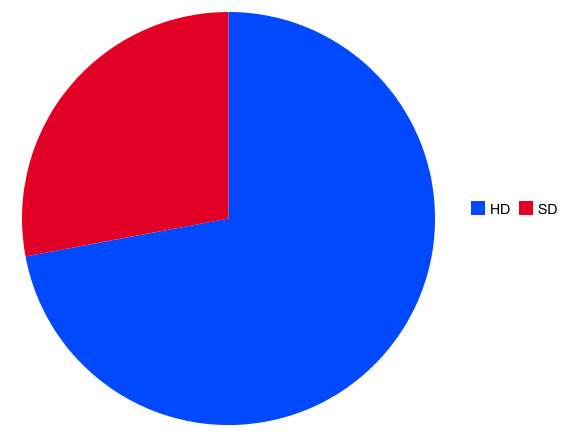
A different ‘future of home viewing’ format is having opposite fortunes: this year, 39 of the new films I watched were in 4K Ultra HD. At just over a third of my total viewing — 33.6% to be precise — it’s its strongest year yet. Still, 1080p HD remains the standard, at 61 films (52.6%), while SD somehow clings in there with 16 films (13.8%). As much as it might seem like “everything’s HD nowadays”, DVD was a far bigger and more diverse format than anything else (bigger than Blu-ray, certainly, and more diverse than streaming offerings, certainly), so — despite all the random stuff that gets 4K upgrades nowadays — of course there’s a lot out there stuck in SD quality, and perhaps always will be. Unless you exclusively watch new releases, SD’s going to be a fact of viewing for a long time yet; perhaps forever.
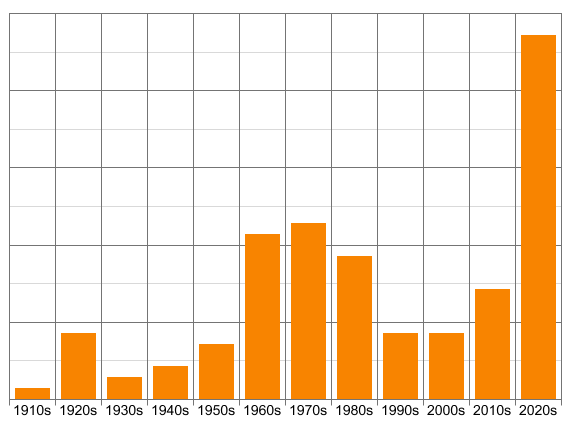
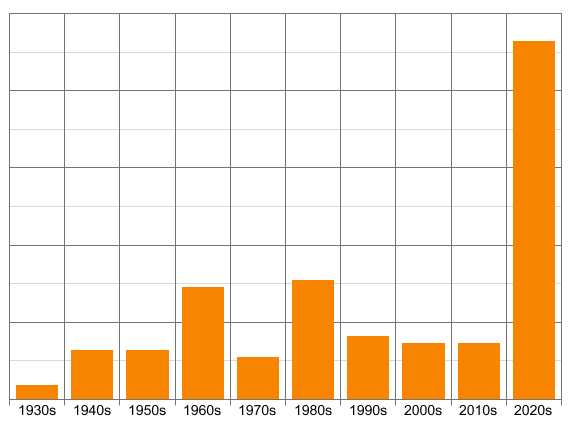
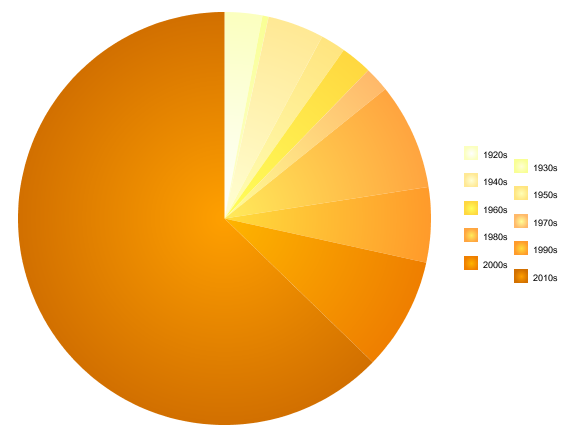
Moving on to time now, and in 2025 I watched something from every decade since 1900 for the first time since 2022. Okay, the 1900s were only represented by a single short film, but there weren’t any features that decade anyway. At the other end of the spectrum, the top decade was — as usual — the current one, i.e. the 2020s, with 33 films (28.45%). That’s actually the lowest percentage for the current decade since 2021, when they were still beaten by the 2010s (which also had a lower percentage — they kind of split the ‘recency’ that year).
Rather than a single other period coming close, it seems my viewing has been spread around, because second-place the 1970s had under half as many films, 16 (13.8%). Right on its tail is the ’60s with 15 (12.9%), and not far behind that is the ’80s on 13 (11.2%).
Only then, in fifth place, do we finally find the 2010s, with 10 films (8.62%), while sixth place is a three-way tie between the 1920s, 1990s, and 2000s, each with (appropriately enough) six films (5.2%). Rounding things out are the 1950s on five (4.3%), the 1940s on three (2.6%), the 1930s on two (1.7%), and the 1910s on one (0.9%).
Honestly, I’m almost surprised the 2020s remain so high, considering how few new films it feels like I’m watching; although, as it’s less than a third overall, I guess that still makes sense.
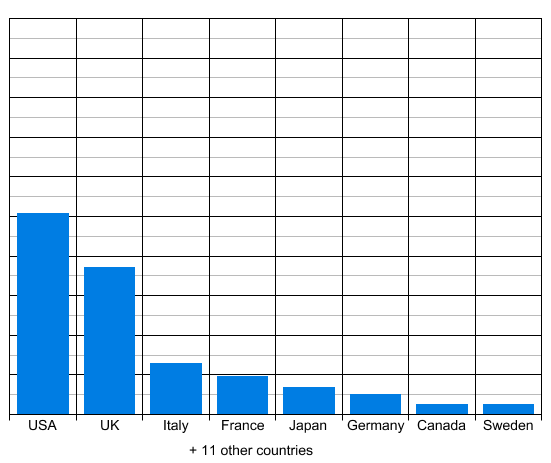
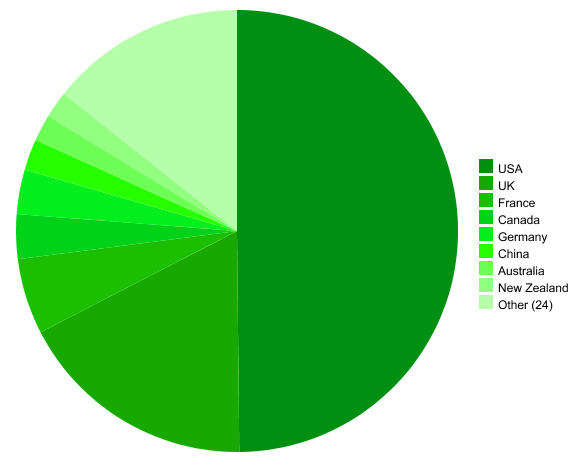
Unfortunately, such upending of norms (okay, maybe that wasn’t an “upending”, but tweaking) doesn’t extend to countries of production, where the USA dominates as always with 59 films, aka 50.9%, which sees it slip back above 50% after dropping below it for the first time last year. Still, that’s its second-lowest percentage since I began recording this, so that’s something… although, on the other hand, the total of 19 countries is down from 31 last year. You win some, you lose some.
Another for the former camp was good old Blighty, with the UK hitting its highest percentage yet at 37.1% from 43 films. All those poliziotteschi I watched for the Challenge helped Italy overleap France for third place, with a total of 15 films (12.9%), although our Gallic cousins still came fourth, with 11 films (9.5%). Continuing down the chart we find Japan on eight (6.9%), Germany on six (5.2%), Canada and Sweden each with three (2.6%), and Australia, Hong Kong, and Spain on two (1.7%) apiece, before eight further countries each have one film (0.9%), the sole total newcomer to my viewing history being Uganda.
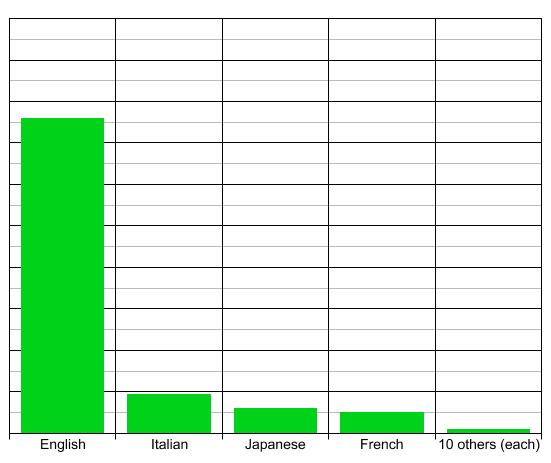
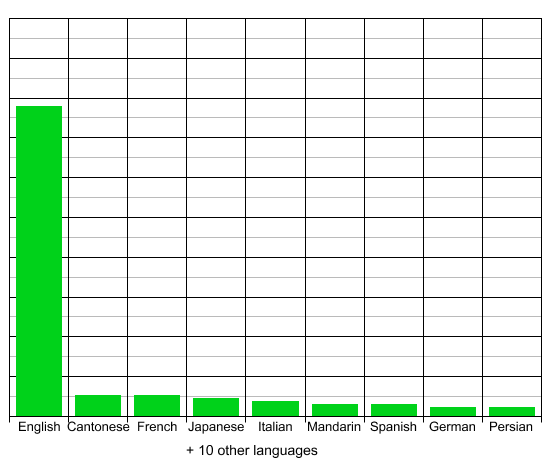
Unsurprisingly, English remains unassailably dominant for languages, featuring significantly in 88 films (75.9%) — although, as it’s only ever dipped below three-quarters once before, getting almost that low isn’t a bad result. A distant second was Italian with 11 (9.5%), those poliziotteschi once again helping to rearrange the usual rankings. The only other languages represented in multiple films were Japanese in seven (6%) and French in six (5.2%). There were 10 other languages in one film each, with uncommon ones for my viewing including Finnish, Irish Gaelic, Luganda, Norse, and Welsh.
A total of 101 directors and seven directing partnerships helmed the feature films I watched in 2025, plus one film with no credited director of any kind. For the first time in three years, two of those directors helmed more than two films: top was Fernando Di Leo with four (all poliziotteschi), followed by Tatsuya Oishi with three (the Kizumonogatari trilogy). The other directors with multiples (two apiece) were Alfred Hitchcock and (for the second year in a row) Robert Tronson (both being entries in the Edgar Wallace Mysteries series, same as last year).
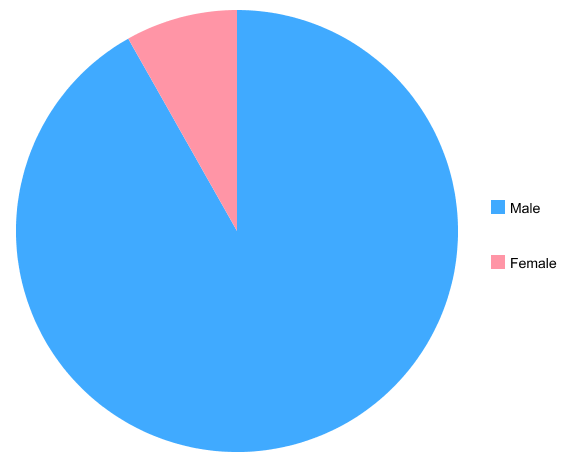
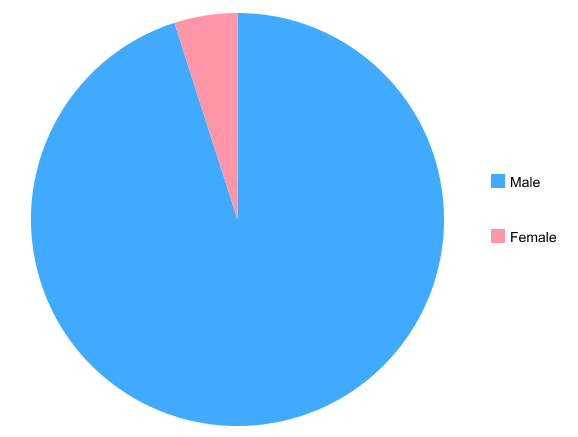
As for women, this year I watched 11 films with a female director, which, when you adjust for those co-directed with a man, comes to merely 8.2% of my viewing — up from last year, and a lot better than it was when I started tracking this in the mid-2010s, but still not great. Indeed, on a percentage basis, it’s my third best year (2020 and 2023 managed to nudge above 11%). I’ve said it before, but it bears repeating every year: I neither avoid nor seek out female directors; I just watch the films I watch and see what number comes out at the end. The industry, undoubtedly, still needs to do more. I hope this graph will continue to improve in the future; but you can’t change the past, so as someone who watches a lot of older films, I can’t imagine it will ever reach 50/50.
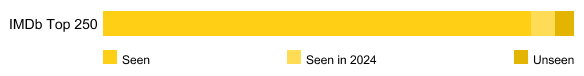
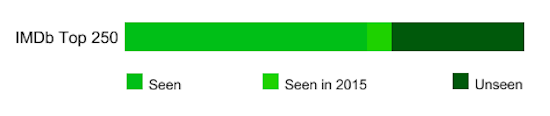
Last year, I made furthering my progress with the IMDb Top 250 part of my Challenge. I did make solid progress, but not enough to get it completed: by the beginning of January 2025, I still had ten films left. Sadly, I can’t say I kept up that momentum, as only one film from my 2025 viewing appears on the chart at time of writing — The Wild Robot at 181st. And because that list is ever-changing, the number I have left to see has actually gone up, and now sits at 15. It’s kind of frustrating, but also indicative of the fact that the list of ‘great movies’ is never truly set in stone.

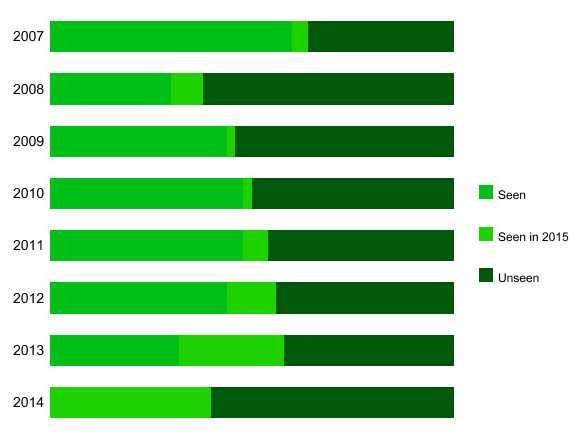
Another mediocre effort at progressing lists comes as we turn our attention to the “50 Unseen”, the list I publish each year of 50 notable films I missed from that year’s new releases. I’ve continued to track my progress with all of those lists as the years have passed, and in 2025 I watched 14 films across all 18 lists. That’s up from 10 last year, but doesn’t match the 20 from the year before, which was already one of my weaker years (I didn’t have the heart to see how this year compared further back). Those 14 were quite spread around amongst the various years, with the single largest being six from 2024’s 50, i.e. last year’s list. That means 2025 ties with 2023 as the second-worst ‘first year’ ever, the one time I’ve done worse being the pitiful four I watched in 2009 from 2008’s list.
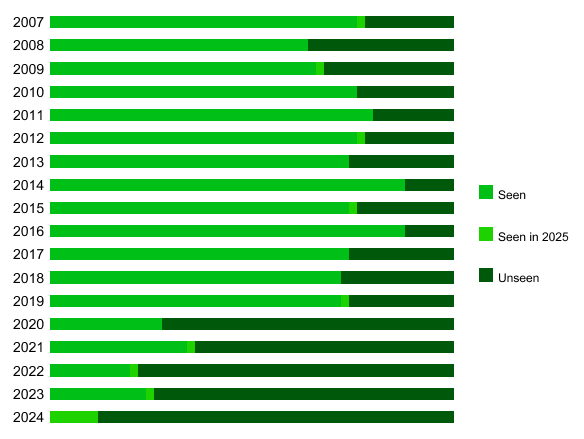
In total, I’ve now seen 557 out of 900 ‘missed’ movies. That’s 61.9%, continuing the decline this has been experiencing since 2022 — it’s one negative side effect of my new Challenge, because I used to pay a fair amount of attention to these, whereas now my focus is on Challenge-qualifying films, where “50 Unseen” titles make up only one ten-film category. The ability to switch around what’s included in the Challenge is within my power, of course, but to get these back above 70% (where it sat from 2018 to 2021) I’d have to watch 108 of them, so even if I wanted to let it take over my entire 100-film Challenge (which I don’t, really) it still wouldn’t do the job. Oh well. (As usual, the 50 for 2025 will be listed in my “best of” post.)
And, before you know it, we’ve reached the end! Well, the climax, at any rate — the final set of stats. I’m talking, of course, about the scores.
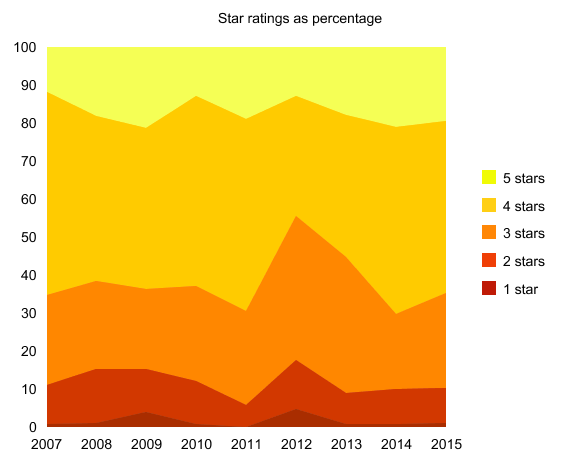
As you may have noticed, I didn’t post a single film review in 2025, but I scored every new film I watched nonetheless. That does mean my precise ratings are flexible until I lock them in by posting a review. Most will still say the same, but there are plenty of films I awarded a half-star on Letterboxd, and as I insist on rounding to a whole star for the blog, some of those have the potential to shift in the other direction (because a half-star doesn’t mean it should automatically round up. I mean, it might’ve already been rounded from, say, 3.3 to 3.5, right? But I really don’t want to start getting that granular with my ratings). Anyway, for the sake of completing these stats, I’ve assigned a whole-star rating to every film, and while it’s theoretically possible I’ll change my mind when I eventually post a review, I’m sure this section will remain broadly accurate.
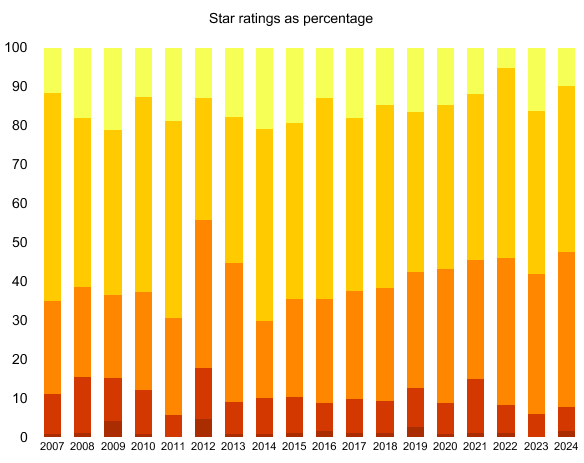
Beginning with the cream of the crop, in 2025 I awarded just four five-star ratings (3.45% of my viewing), the lowest number ever. Raw numbers and percentages can paint very different pictures (four from 116 films is statistically pretty different than if it were from the 264 films I watched in 2020), but even then it’s well below where this figure sits on average, which is above 15%. Well, it is what it is — I don’t grade with the intention of hitting the same curve every year, so my 2025 viewing was simply lacking in this regard.
That said, other scores remain typically healthy. The most common score was four stars, which I handed out to 54 films (46.6%). That’s marginally above the historical average of 44.8%, but is also lower than seven previous years, so sits in the upper-middle overall. Not too far behind were the 45 three-star films (38.8%). Only once have the three-stars overtaken four-stars to be the dominant rating (in 2012), although they have been within a few percentage points of each other sometimes. This year, the difference of 7.8% is towards the closer end (five years were even closer), so while it’s not the greatest year, it’s not the most mediocre either.
As for the actually ‘bad’ ratings, there were 12 two-star films (10.34%) and only a single one-star film (0.9%). In fact, I almost didn’t give out any one-star ratings this year, which would have made 2025 just the third year where that happened; but then I decided Ice Age: Collision Course really was terrible enough that two stars would be too generous, so here we are.
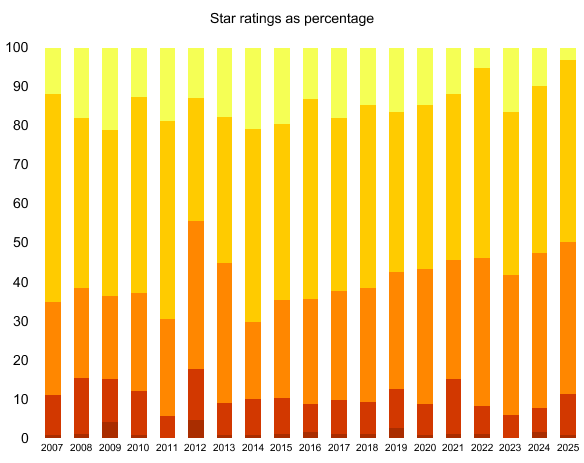
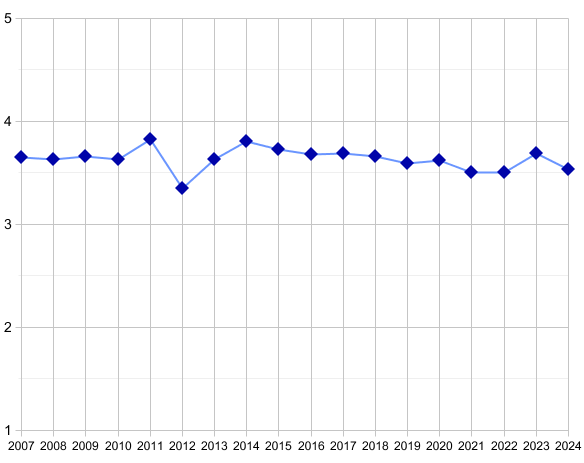
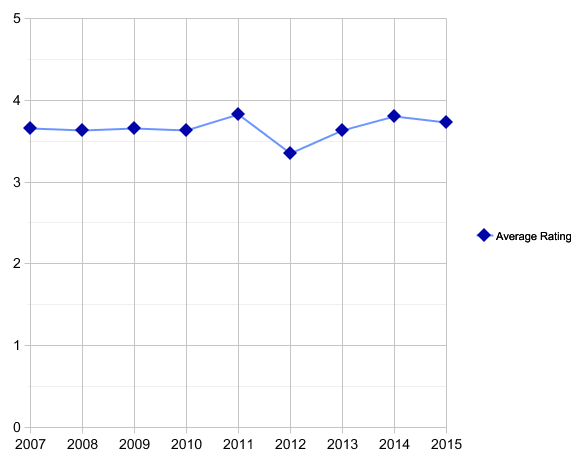
That brings us the average score — a single figure to quantify 2025’s quality compared to other years. The short version is 3.4 out of 5. That might not sound terrible — it’s still above the halfway point of 2.5 or the notional average of 3.0 — but it’s actually only the second time my annual average has been below 3.5. Being one of the two weakest years of the past almost-two-decades is, well, not good. It’s not the lowest of all, though: if we add a few more decimal places, we see 2025 averaged 3.414, which is still notably high than 2012, which at 3.352 was a smidgen off rounding to 3.3. Still, it represents a further tick down for the line.
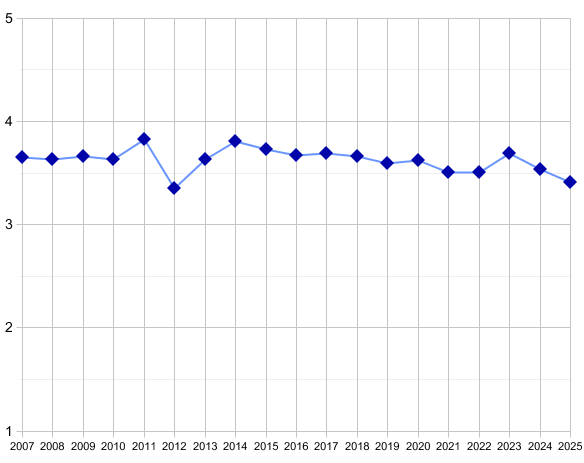
Honestly, I’m not surprised: it’s felt like a very “decent but not great” year throughout, a perception which is supported by the still-solid number of 4-star films but almost total absence of 5-stars. That’s the way it goes sometimes, although 2025 has demonstrably been worse for it than normal. It does make me wonder if next year I should put more energy into seeking out better-regarded films. Not that that’s a guarantee of success (I’ve bounced off plenty of highly-acclaimed classics and, conversely, loved my fair share of less-beloved cult classics and other people’s write-offs), but it improves the odds. Either way, we’ll see what 2026 brings this time next year.

More quantifying of quality as I distil those 116 first-time watches to my favourite 10%.


